Distribution of Water Quality Data
The data illustrated here are based on the long-term means (average of all the historical annual averages) for each parameter measured in Maine lakes. Every effort has been made to ensure that the data are representative.
Data Source: LSM and Maine DEP
This page contains histograms (a graph that shows how the data are distributed for a particular variable) of the indicators of lake water quality for the lakes that have been included in each data set. The number of lakes sampled (N) varies for each lake quality indicator. The range of means, the statewide mean, and the number of lakes sampled are shown with each graph.
As you view this information, please be aware that lake water quality varies from year to year. However, the distribution of data in these graphs shows little change from year to year, because of the cumulative nature of the information being illustrated. Water quality indicators for individual lakes may show substantial annual variation.
Secchi Disk Transparency
A measure of water clarity; the distance one can see down into the water column (Figure 1).
Factors that affect transparency include algal growth, zooplankton, natural water color, and suspended silt particles. Because algae are the most abundant particles in most lakes, transparency indirectly measures algal growth. Transparency values vary widely in Maine lakes. Unless a lake is highly colored or turbid from suspended sediment, transparency readings of 2 meters or less generally indicates a severe algal bloom.
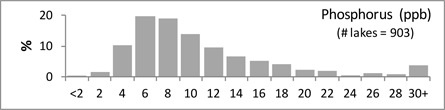
Total Phosphorus
A measure of all forms of phosphorus (organic and inorganic) in the water (Figure 2).
Phosphorus is one of the major nutrients needed for plant growth. Because it’s natural occurrence in lakes is very small, phosphorus “limits” the growth of algae in lake ecosystems. Small increases in phosphorus in lake water can cause substantial increases in algal growth. Phosphorus is measured in parts per billion (ppb). Phosphorus concentrations may be based on samples taken from the surface of the lake or from discrete samples taken at specific depths, or from an integrated water column (epilimnetic core) sample.
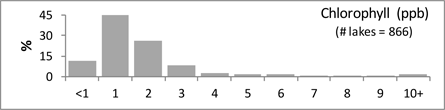
Chlorophyll-α (CHL-α)
A pigment found in algae and other plants used to estimate biological productivity of lake ecosystems. (Figure 3)
By measuring the concentration of CHL-α in lake water, the algae population can be estimated. CHL-α is measured in parts per billion (ppb). Figure 3 illustrates the distribution of CHL-α in Maine lakes.
CHL-α samples are generally obtained from an integrated water column sample because the greatest concentration of algal growth typically occurs from the surface of the lake to the bottom of the epilimnion or the top of the thermocline.
Transparency, total phosphorus, and CHL-α are sometimes referred to as “trophic state” indicators, or indicators of biological productivity in the lake ecosystem. Table 1 equates general levels of productivity for Maine lakes with levels or concentrations of the three trophic state indicators.
Table 1
| Level of Productivity | Transparency (Meters) | Total Phosphorus (parts per billion) | Chlorophyll-α (parts per billion) |
|---|---|---|---|
| Low | >8.0 | <4.5 | <1.5 |
| Medium | 4.0 – 8.0 | 4.5 – 20 | 1.5 – 7.0 |
| High | <4.0 | >20 | >7.0 |
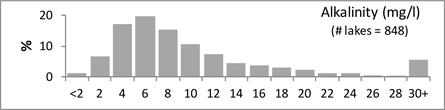
Alkalinity
A measure of the capacity of water to neutralize acids, or buffer against changes in pH. (Figure 4)
Alkalinity is also referred to as “buffering capacity.” It is a measure primarily of naturally available bicarbonate, carbonate, and hydroxide ions in the water. Alkalinity is measured in milligrams per liter (mg/l).
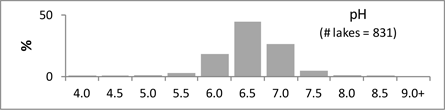
pH
A measure of the relative acid-base status of lake water. (Figure 5)
pH helps determine which plant and animal species can live in the lake, and it governs biochemical processes that take place. The pH scale ranges from 0-14, with 7 being neutral. Water is increasingly acidic below 7, and increasingly alkaline above 7. A one unit change in pH represents a tenfold change in acidity or alkalinity. The pH scale is the inverse log of the hydrogen ion concentration.
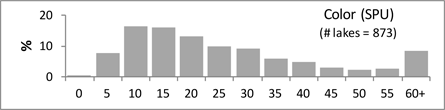
Apparent Color
The concentration of natural, dissolved, humic acids in lake water. (Figure 6)
Organic “Humic” acids leach from vegetation in the lake watershed. Color is measured in Standard Platinum Units (SPU). Lakes with color levels greater than 25 SPU are considered to be colored. This can cause transparency to be reduced, and phosphorus levels to be elevated. The water in highly colored lakes often has the appearance of tea. When lakes are highly colored, the best indicator of algal growth is Chlorophyll-α. Figure 6 illustrates the distribution of color in Maine lakes.
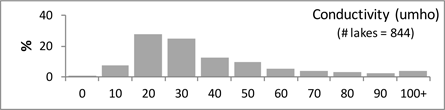
Specific Conductance
A measure of the ability of water to carry an electrical current. (Figure 7)
Conductivity is directly related to the level of dissolved ions in the water. Conductivity levels will generally increase if there is an increase in the concentration of pollutants in the water. Conductivity is measured in micro-siemens per centimeter (µS/cm).
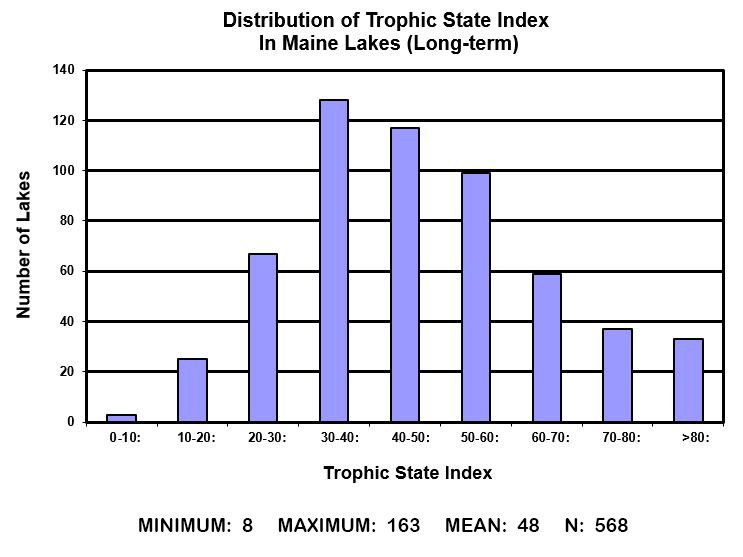
Trophic State Index
A simplified index of biological productivity in lakes. (Figure 8)
The Trophic State Index (TSI) was developed in 1977 by Robert Carlson as a means to be used for establishing a simple numerical scale for each of the three indicators of lake water quality that are commonly used to measure (directly or indirectly) lake productivity. Because the units of measurement and scale for Secchi disk transparency, total phosphorus and chlorophyll-α differ, the TSI provides a convenient means by which the three indicators can be compared. The TSI converts raw data from each of the three indicators to standard numerical scales that range from 0 to over 100, with higher numbers representing increasing productivity, and typically poorer water quality. The TSI models developed by Carlson have been modified for Maine lakes, based on historical data for each indicator.